Research findings: AI for automated debugging
This page summarizes research findings from the dissertation Leveraging AI for Automated Self-Healing in Web Applications: Addressing Maintenance and Debugging Challenges (Jany Laurence Martelli, OPIT BSc Modern Computer Science, 2025). The summaries and tables below support how Patcherly's metrics (time saved, money saved, success rate, manual burden) are defined and why context-aware AI improves outcomes.
Figures
Note: Figures 1 and 2 below describe diagrams of the initial prototype - the base on which the whole of Patcherly was later built from scratch. They describe the research prototype's design and data flow; the current product evolved from this foundation.
Figure 1: AI Web Assistant App: DSR and architecture (helicopter view)
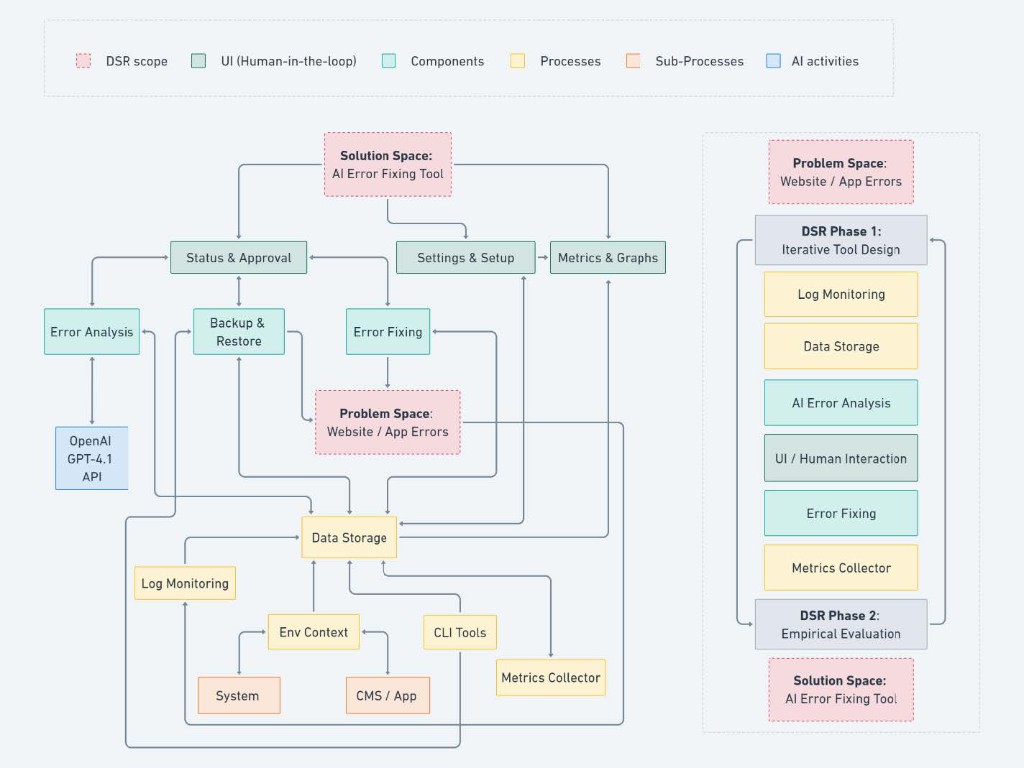
The Design Science Research (DSR) methodology is shown: iterative cycles between the problem space (web application errors) and the solution space (AI-driven error fixing). The diagram highlights core processes, human-in-the-loop approval (e.g. patch approval, reject patch, manual restore), and how AI activities integrate with monitoring and fixing.
Key references: Hevner et al. (2004); Sun et al. (2024); Alaboudi & LaToza (2022).
Figure 2: Major components and how they interact
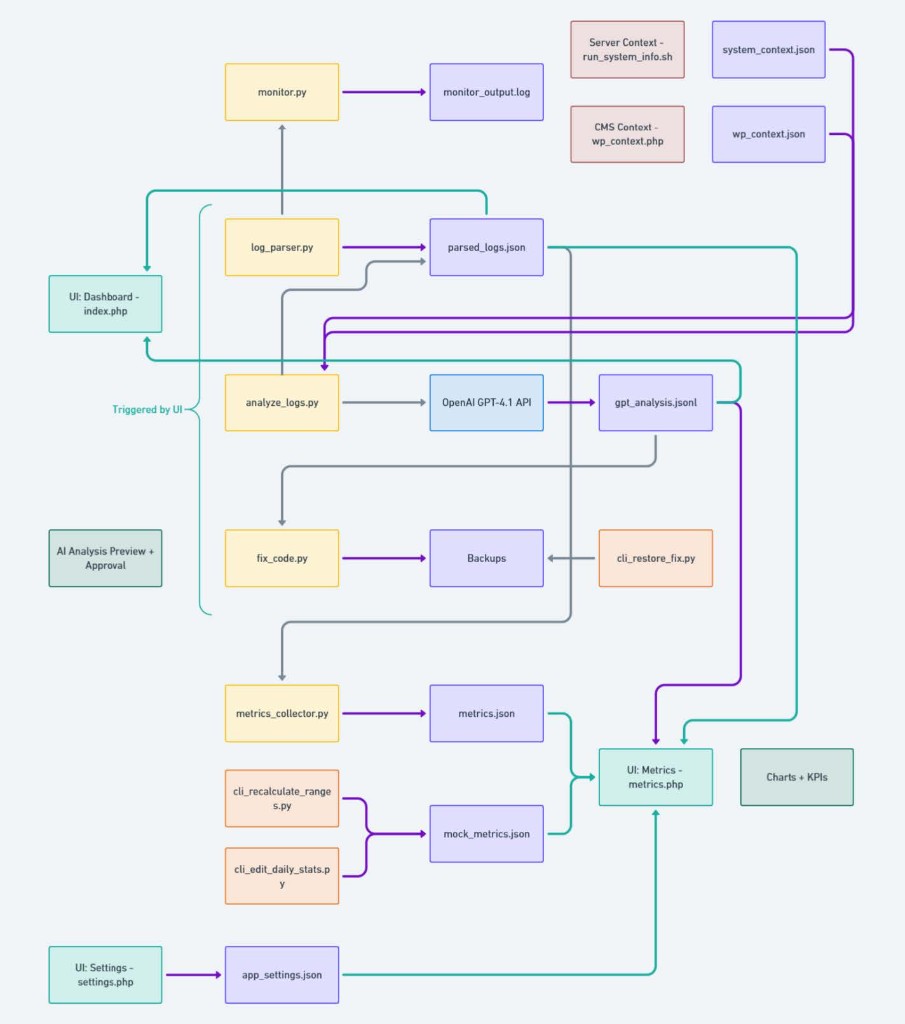
Illustrates the main prototype components: log monitoring/parsing, AI-driven analysis (e.g. GPT-4), safe patch application with backup, and metrics/dashboard aggregation. These form a pipeline for monitoring, patching, and tracking metrics.
Key references: Chen et al. (2021); OpenAI GPT-4.1 (2024); Pramod et al. (2024); Widyasari et al. (2020).
Figure 3: Baseline vs. context-enriched AI outcomes (3k sessions/day)
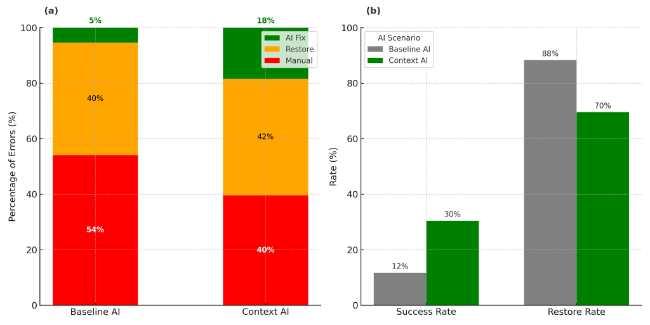
Two-panel chart. Left: distribution of error resolutions - context-enriched AI resolves about 18% of errors (green "At fix") vs. 5% for baseline; manual load (red) is lower with context. Right: quality of AI fix attempts - with context, success rate more than doubles (30% vs. 12%) and rollback rate drops (70% vs. 88%), indicating more effective and reliable fixes.
Key references: Shuster et al. (2021); Du et al. (2023); Ehsani et al. (2025); Parasaram et al. (2024).
Figure 4: Annual debugging hours vs. traffic scale
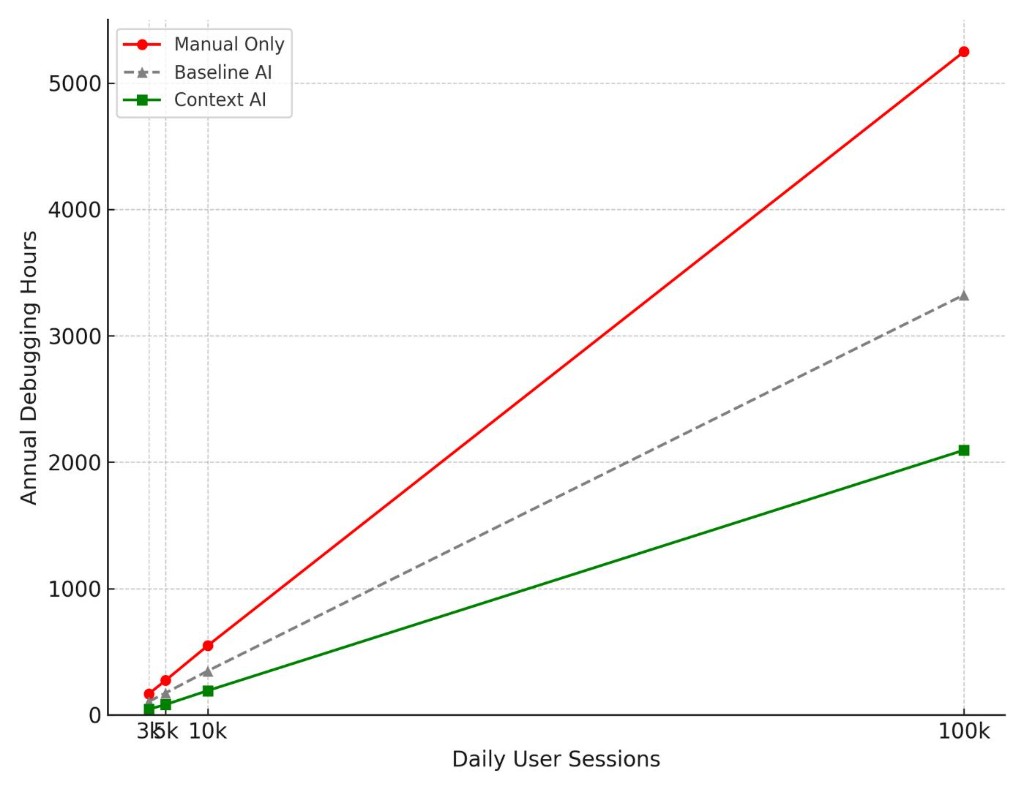
Annual manual debugging workload (hours) under three approaches - manual only, baseline AI, and context-enriched AI - plotted against daily traffic from 3k to 100k sessions. Manual-only scales roughly linearly (~167 h/year at 3k/day up to ~5,248 h/year at 100k/day). Baseline AI gives modest improvement; context-enriched AI substantially reduces required human debugging time (e.g. at 100k sessions/day, from ~5,248 h to ~2,095 h, about a 60% reduction).
Key references: Baqar et al. (2025); Arora et al. (2024).
Figure 5: Effect of traffic scale on AI success rate and manual burden
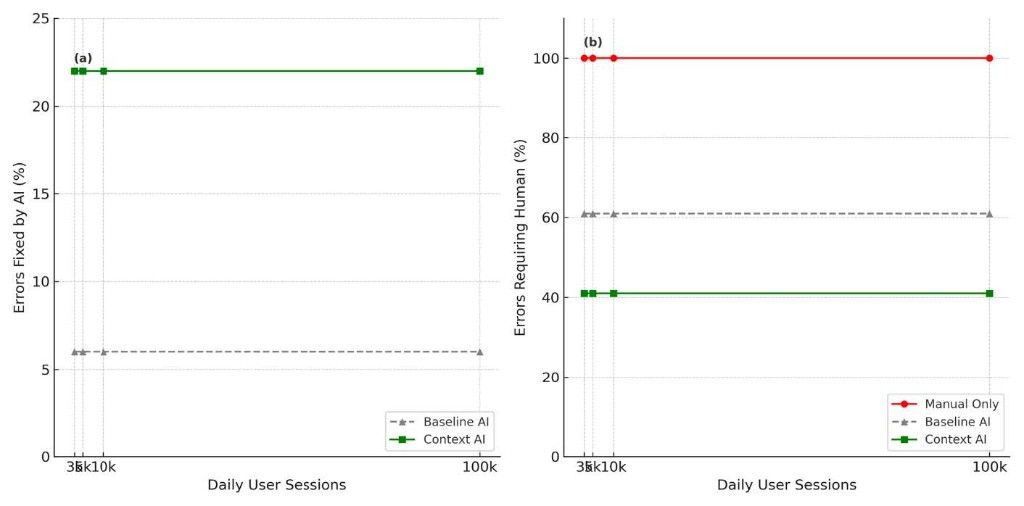
Two-panel chart. Left: AI fix success rate vs. scale - context-enriched AI consistently fixes about 20 - 22% of all errors; baseline AI plateaus around 5 - 6% even at 100k sessions/day. Right: manual burden (share of errors requiring human intervention) - with context-enhanced AI, manual involvement stays around 41% vs. ~61% for baseline, with little change as sessions grow.
Key references: Yang et al. (2025); Sun et al. (2024).
Tables
Table 1: Errors and AI metrics by type and application context (PHP and Python)
| Error Type | Context | Frequency (% overall) | Avg. Attempts/Day | AI First-Try Success Rate (%) | Manual Fix Rate (%) | Avg. AI Fix Time (min) | Avg. AI Confidence (%) Heuristic |
|---|---|---|---|---|---|---|---|
| Syntax | CMS | ~5 - 15 | ~1.0 - 2.0 | ~40 - 60 | ~45 - 60 | ~5 - 15 | ~90 |
| Syntax | General Apps | ~1 - 5 | ~0.1 - 0.2 | ~35 - 50 | ~50 - 65 | ~5 - 15 | ~90 |
| Typo | CMS | ~5 - 10 | ~0.5 - 1.0 | ~45 - 65 | ~35 - 55 | ~5 - 15 | ~85 - 90 |
| Typo | General Apps | ~5 | ~0.2 - 0.3 | ~40 - 55 | ~45 - 60 | ~5 - 15 | ~85 |
| Logic | CMS | ~50 - 60 | ~0.3 - 0.7 | ~15 - 35 | ~70 - 85 | ~30 - 60 | ~70 |
| Logic | General Apps | ~60 - 70 | ~0.5 - 1.0 | ~5 - 20 | ~80 - 95 | ~30 - 60 | ~60 |
| Null Ref | CMS | ~10 - 15 | ~0.2 - 0.5 | ~25 - 45 | ~55 - 75 | ~10 - 25 | ~80 |
| Null Ref | General Apps | ~10 - 20 | ~0.3 - 0.5 | ~20 - 35 | ~65 - 80 | ~10 - 25 | ~75 |
| Other | CMS | ~8 - 10 | ~0.3 - 0.4 | ~10 - 25 | ~75 - 90 | ~20 - 40 | ~60 |
| Other | General Apps | ~5 - 10 | ~0.1 | ~8 - 20 | ~80 - 92 | ~20 - 40 | ~50 |
Key references: Rollbar (2021); Pramod et al. (2024); Duò (2025); Widyasari et al. (2020); Sobania et al. (2023); Jiménez et al. (2023); Liu et al. (2024); Chidambaram et al. (2024); Yuan et al. (2025); Yang et al. (2025).
Table 2: Averaged AI debugging metrics across web domains
Blended view for Web CMS and general applications.
| Error Type | Frequency (% overall) | Avg. Attempts/Day | AI First-Try Success Rate (%) | Manual Fix Rate (%) | Avg. Fix Time (min) | Avg. AI Confidence (%) Heuristic |
|---|---|---|---|---|---|---|
| Syntax | ~6.5 | ~0.825 | ~46.25 | ~55 | ~10 | ~90 |
| Typo | ~6.25 | ~0.5 | ~51.25 | ~49 | ~10 | ~87.5 |
| Logic | ~60 | ~0.625 | ~18.75 | ~82.5 | ~45 | ~65 |
| Null Ref | ~13.75 | ~0.375 | ~31.25 | ~68.75 | ~17.5 | ~77.5 |
| Other | ~8.25 | ~0.225 | ~15.75 | ~84.25 | ~30 | ~55 |
Key references: Same as Table 1 (aggregated averages).
Table 3: Median AI-fix restore rate by error type
| Error Type | Median Restore Rate | Academic/Industry Source(s) |
|---|---|---|
| Syntax | 45 - 55% | Moderate restore rate; Getafix deployment ~58% overall rejection (Bader et al., 2019). |
| Typo | 40 - 50% | Lower restore rate; clear-cut fixes (Bader et al., 2019). |
| Logic | 70 - 85% | Highest restore rate; SapFix ~85% rejection for complex bugs (Marginean et al., 2019). |
| Null Ref | 60 - 70% | High restore rate; context-aware null-safety (Pramod et al., 2024). |
| Other | 75 - 85% | Very high for miscellaneous issues (Liu et al., 2024). |
Key references: Bader et al. (2019); Marginean et al. (2019); Liu et al. (2024); Pramod et al. (2024).
Table 4: Typical bug resolution times (manual human debugging)
| Error Type | Description | Avg. Fix Time | Min: Max | Academic/Industry Source(s) |
|---|---|---|---|---|
| Syntax | Mistakes in code syntax (e.g. missing semicolons, unmatched brackets). | ~30.5 min | 1 - 60 min | Ahadi et al. (2016); Alaboudi & LaToza (2022); Afzal & Goues (2018) |
| Typo | Minor misspellings in variable/function names or wrong operators. | ~10.5 min | 1 - 20 min | Conijn et al. (2019); Afzal & Goues (2018) |
| Logic | Flaws in program logic or algorithms. | ~62.5 min | 15 - 180 min | Zeller (2003); Alaboudi & LaToza (2022) |
| Null Ref | Runtime errors (e.g. null-pointer) accessing uninitialized objects. | ~97.5 min | 5 - 120 min | Alaboudi & LaToza (2022); Afzal & Goues (2018) |
| Other | Rare, integration, configuration, or miscellaneous errors. | ~130 min | 20 - 240 min | Alaboudi & LaToza (2021); Rollbar (2021); Zeller (2003); Tassey (2002) |
These ranges underpin the expected fix time (min/max) used in Patcherly’s Settings → Business metrics error type configurations and in the time saved and money saved calculations on the Metrics page.
Table 5: Baseline vs. context-enriched AI performance (3,000 sessions/day)
| Metric | Baseline AI | Context-Enriched AI | Improvement |
|---|---|---|---|
| Total Errors (1 year) | 699 | 699 | - |
| Fixes Attempted (AI) | 307 | 404 | +31.6% |
| Successful AI Fixes | 36 | 123 | +241.7% |
| Success Rate (of attempts) | 11.7% | 30.4% | +159.6% |
| Fixes Restored (Rollbacks) | 271 | 281 | +3.7% |
| Restore Rate (% of attempts) | 88.3% | 69.6% | −21.2% * |
| Manual Interventions | 362 | 265 | −26.8% * |
| AI Efficiency (% of AI vs AI+Manual) | 9.0% | 31.7% | +250.5% |
| Error Resolution Rate (% of total errors) | 5.4% | 18.4% | +241.7% |
| Average Confidence Score | 70.3% | 96.6% | +37.4% |
| Total Time to Fix (hours) | 106.4 | 45.5 | −57.2% * |
| Total Money to Fix ($) | $8,515 | $3,644 | −57.2% * |
| Hours Saved (vs. all-manual) | - | 61.1 | - |
| Cost Saved (vs. all-manual) | - | $4,892 | - |
*Negative is better (fewer rollbacks, less manual work, less time/cost).
Key references: Du et al. (2023); Ehsani et al. (2025); Parasaram et al. (2024); Shuster et al. (2021); Chen et al. (2021); Arora et al. (2024); Baqar et al. (2025).
Table 6: Scalability of AI debugging performance at different traffic volumes
| Traffic | Total Errors/Year | AI Fixes (Baseline) | AI Fixes (Context) | Manual Errors (Baseline) | Manual Errors (Context) | Time Saved (hours) | Cost Saved (USD) |
|---|---|---|---|---|---|---|---|
| 3k/day | 669 | 36 | 123 | 362 | 265 | 61 | $4,892 |
| 5k/day | 1,117 | 57 | 227 | 689 | 475 | 122 | $9,791 |
| 10k/day | 2,212 | 153 | 468 | 1,446 | 1,012 | 298 | $23,818 |
| 100k/day | 21,882 | 1,568 | 4,642 | 16,581 | 10,588 | 3,160 | $252,805 |
For each daily session rate, the table shows total errors per year and outcomes for baseline vs. context-enriched AI: errors fixed by AI, errors requiring manual fix, and estimated time and money saved by the context-enriched assistant. Benefits scale with traffic.
Key references: Baqar et al. (2025); Arora et al. (2024); Vankayalapati & Pandugula (2022).
How this relates to Patcherly’s metrics
- Time saved and money saved on the Metrics page use the same idea: expected human fix time (from error-type min/max in Settings → Business metrics, informed by Table 4) minus actual AI fix time, then multiplied by your hourly rate.
- Patch success, Active errors fixed, manual burden, and rollbacks on the dashboard match the definitions used in the tables and figures (dashboard Patch success = successful AI fixes ÷ finished apply attempts; Active errors fixed = Successfully applied ÷ active errors; manual burden = share of errors needing human intervention).
- Context-enriched AI in the research corresponds to Patcherly’s use of error context (logs, stack traces, code snippets) to generate and rank fixes; the figures and tables show why this leads to higher success rates and lower manual burden than a baseline without that context.
For the exact formulas and filters, see Understanding metric cards.